%20Logo_BlueOrange_Trademark.png?width=800&height=269&name=Ready%20North%20(RN)%20Logo_BlueOrange_Trademark.png)


.jpg?width=300&name=Services%20Hub%203%20(3).jpg)


 In most cases, marketers are creative sorts. We are communicators and storytellers, strategists and promoters. When we signed up for this gig, few (if any) of us came at it from an interest in statistics and math.
Yet here we are, marketing in the digital age, where everything we do is trackable and we are without want for performance data. We are now expected to make marketing decisions based more on metrics than experience and intuition.
Unfortunately, this new job requirement also adds hours to our weeks and/or months, pulling reports, trying to process data, and creating presentations that in many cases will be outdated by the time they are delivered.
So what are we to do? Is there a way to automate aspects of marketing performance reporting that relieve us of this unwanted task, while also saving time?
The answer is “Yes” (to an extent). Using readily available and sometimes free technologies, you can automate a good portion of the reporting process, freeing you to do what you do best, just better informed.
4 Ways to Automate Reporting
1. Custom Alerts
Real-time notifications of performance data fluctuations are valuable when attempting to capitalize on unexpected and timely opportunities.
Say for example, by 9 a.m. traffic from social media has topped the daily average. A custom alert can help you discover that one of your blog posts was shared by an influencer. Now, you can promptly join and promote on the conversation.
Consider setting up daily alerts for overall website traffic as well as individual channels (e.g. organic, social, referral, etc.). You may also consider adding or scaling back to weekly alerts depending on your needs.
Considerations for Custom Alerts
Most marketing technologies will enable you to set up alerts based on some aspect of your program. The one we most commonly use is Google Analytics. With Google Analytics, you can set up custom alerts for any metric, which are then triggered based on the total value or percentage of an increase or decrease.
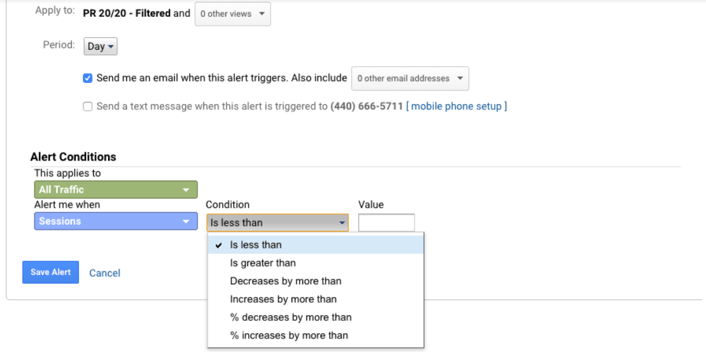
To create your alert trigger:
- Start by defining the mean of your chosen metric over a three month time period.
- Identify the average highs and/or the average lows over the same three-month period. You don’t have to be super specific, a rough ballpark will do.
- Calculate the difference between your three-month mean and the average high or low. This is the number or percentage you’ll use for your alert.
Ideally, an alert exists for both the high and low values.
2. Dashboards
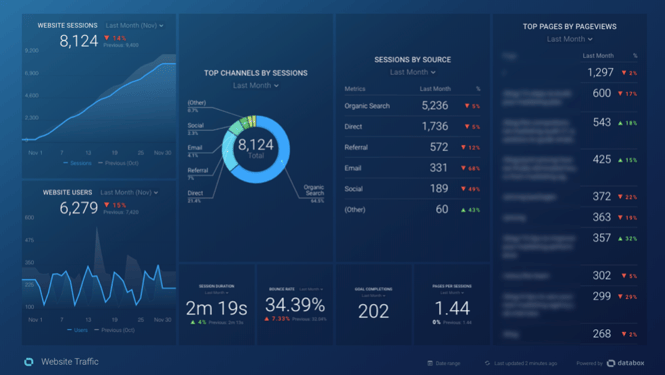
Charts and graphs are essential components to reporting. They help to visually tell the story of what happened with your marketing performance. As it relates to automation, most data visualization tools don’t require repeated setup once configured.
How To Configure Your Dashboards
To tell a complete story with your dashboards, focus in on one key performance indicator (KPI). Make that the primary focal point on the dashboard, and then surround it with the supplemental metrics that provide valuable context.
For example, on a dashboard focused on traffic sessions, you may use average time on site, bounce rate, pages per visit and goal completions to explain how engaged and qualified this traffic was.
Data Visualization Tool Options
There are a variety of data visualization tools available, each with their pros and cons. The two we like best (both with free options) are:
- Google Data Studio: A free tool provided by Google that offers easy to set up and customizable, interactive dashboards. It natively integrates with Google Products (e.g. Ads and Analytics), but also offers connectors to other platforms through third-party developers.
- Databox (recommended): With free and paid versions, Databox can integrate with more than 70 different technologies. They offer a library of template dashboards to choose from and a variety of different visualization modules.
With both of these tools, you can choose to share the dashboards via link or export them as PDFs.
3. Automated Narratives
A great way to supplement a dashboard is to pair it with a written report. With a narrative explaining the visualizations, you get the opportunity to explain and provide context.
The challenging part is this is probably the least enjoyable aspect of the job, and takes the most time. Fortunately, there are solutions available to help in this regard also.
For the routine questions you’ll ask of your marketing performance data, technologies have defined the series of probing questions that can be used to answer what happened and why. These technologies then pull in the relevant answer via API, process it, and then ask the appropriate follow-up questions.
What’s nice for you is when this data is paired with a natural language generation (NLG) technology, you can receive concisely written, personalized performance narratives explaining your data.
Written Analytics Narrative Options
We’ve evaluated quite a few solutions for this service. Of the ones we analyzed, many got too granular, and others tried to put a positive spin on whatever the data was showing (even if traffic fell a significant amount).
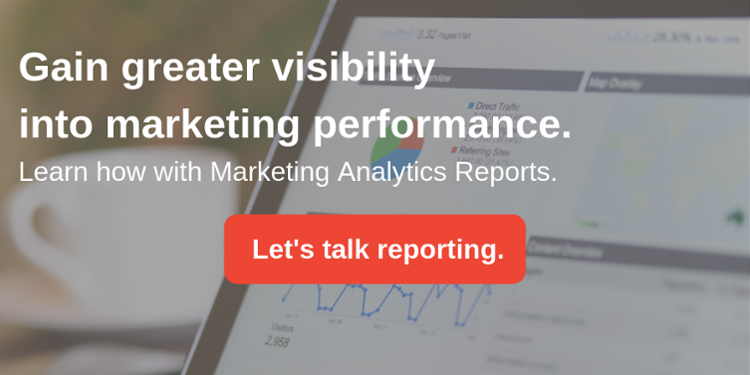
All of this led us to create our own solution. Ready North’s Marketing Analytics Reports ask and then answer 12 questions of your marketing performance data each month. These reports are then sent to you by the second business day of the month, in the format of your choosing. Click below to check out our narratives, which are only $150/report.
See our Marketing Analytics Reports in action with sample data. Or, learn how Ready North can generate a free Marketing Analytics Report using your own Google Analytics data.
4. Artificial Intelligence
One of the exciting things that is rapidly evolving the marketing industry is artificial intelligence (AI). AI can take huge datasets, process them millions of times faster than a human, and unearth useful correlations you’d never have found otherwise.
Marketing performance data is a perfect opportunity to capitalize on some of the advantages of AI. The one tool that is currently doing this is well is Google Analytics.
Available on all Google Analytics accounts, Insights (located in the top right on desktop and their app) surfaces anomalies for you, including items like:
- Pageview spikes.
- Week-over-week performance.
- Performance above average.
- Drops in conversion rates.
- Trends.
- User sources.
- And much more.
Unfortunately, Google Analytics Insights is limited in what it can recommend, and there aren’t many other technologies that can analyze the data and present intelligent, personalized campaign recommendations. Despite advancements in AI, the marketing technology is not quite there yet.
It’s Worth The Upfront Effort
At the end of the day, performance reporting and analysis will make everything we do from a marketing perspective smarter. The challenge will always be processing the data and drawing out insights.
The good news is, the more accustomed you get to the data and the more you can automate, the easier the process gets. As you start to see the data and your analysis leading to wins and growth, the less burdensome and more fun the task becomes.
Turn Data Into Intelligence, and Intelligence Into Action
PR 20/20 Marketing Analytics Reports are timely narratives that ask and answer important questions about your website, blog, and goal/lead performance using Google Analytics and/or HubSpot data.
Delivered monthly, our advanced text-based analysis explain what happened, why and how it compares to a previous time frame. Reports give you the context to make smarter, more informed marketing decisions.