%20Logo_BlueOrange_Trademark.png?width=800&height=269&name=Ready%20North%20(RN)%20Logo_BlueOrange_Trademark.png)


.jpg?width=300&name=Services%20Hub%203%20(3).jpg)


Great marketers understand the importance of having good data on their businesses. So much, in fact, that they’re doing everything they can to get their hands on as much data as possible.
That’s great! We recommend that. But what are you doing with all of the data you’re collecting?
For many of us, the answer is glancing at our collected analytics once a month, quarter or year because we don’t really have the time to deep dive through Google Analytics and excel spreadsheets.
All that telling data you’re collecting, including trends and insights your boss and CEO might be very interested in, is going to waste.
Enter Databox.
Databox is a data visualization tool that enables marketers and business professionals to simplify and streamline specific KPI reporting using charts and graphs.
There is power in presenting the right data to the right people at the right time, enabling them to gain insights effectively.
Below, we break down the five ways you can use Databox and data visualization to step up your performance reporting game.
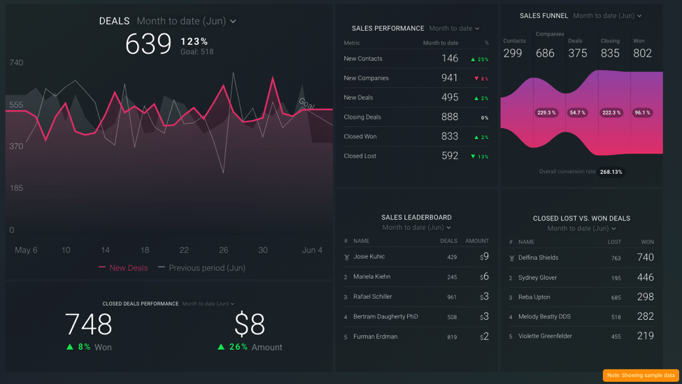
1. Focus On the Metrics That Matter
You can track every metric under the sun if you’d like. But unless you have an AI-powered personal assistant to sift through it all, it won’t do you much good.
As a team, collectively decide on business KPIs and campaign goals to guide your data visualization, then use dashboards to tie the data together.
Databox enables you to set up dashboards for each type of analysis: website performance, lead generation results, financial health and more. Still not sure which data you need? Databox offers a library of customizable templates and widgets to get you started.
 Source: Databox
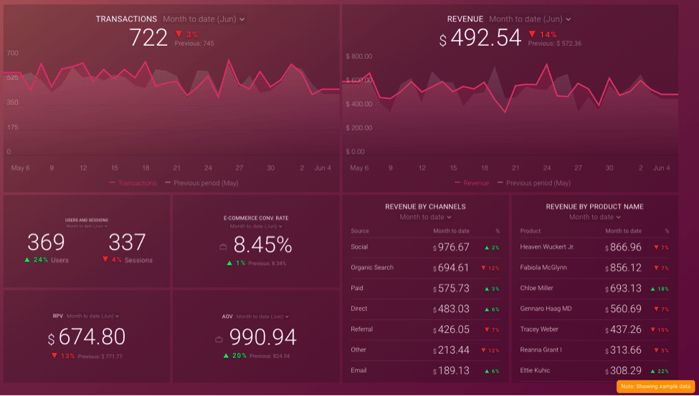
2. Identify Areas That Need Attention or Improvement
Finding the time to pull performance metrics is a thing of the past. Make your data work for you to track how KPIs perform over time, as often as you’d like.
Using Databox’s interactive dashboards enable you to toggle between specific timeframes (today, this week, last 30 days, this quarter or last year) and compare them to the previous interval, as well as established goals.
This means you will be more aware of areas that need your attention immediately, not at the end of the month when it’s too late to make an impact.
For example, wouldn’t you want to know right away if your monthly transactions and revenue were simultaneously decreasing, like in the dashboard below?
 Source: Databox
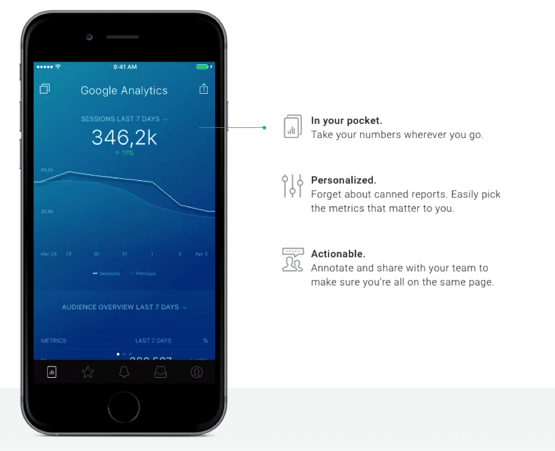
3. Track Everything in One Place From Any Device
Performance data from Google Analytics, HubSpot, Salesforce and Facebook ads are powerful on their own. But figuring out how it all connects can be a challenge.
Traditionally, this would require you to pull reports on each of these systems and then manually compare, contrast and evaluate performance.
To solve this problem (and save you time), Databox brings all your data sources together in one place with over 200 integrations to the most popular marketing, sales, analytics, social media and eCommerce platforms. As you customize your dashboards, you can combine data from all sources to showcase the most well-rounded picture of your company’s performance at that exact moment.
Even better, all this integrated data is available from a computer, tablet or smartphone. With Databox’s mobile app, morning briefings keep you regularly updated, push notifications alert you when something needs your attention and dashboards can be easily annotated and emailed to colleagues to keep everyone on the same page.
 Source: Databox
4. Communicate the Story to Others
Instead of pouring through spreadsheets and typing up a report for your boss that details the most recent findings, Databox seamlessly puts the most relevant data in your boss’ hands.
However, just because us data junkies understand which trend lines indicate what, doesn’t mean everyone else will. Level-up your reporting with Databox’s text tool. Text integration enables you to support your charts and graphs by calling out key highlights and areas that need attention. Together, these tools will better communicate your business’ performance to your team, supervisors, C-suite and beyond.
Databox also offers several sharing options to keep everyone in the loop. Email screenshots on demand or on scheduled dates and times. Create a link to the live, interactive dashboard to share just one or all of the dashboards. Protect the privacy of your data by setting the URL to expire after a certain period of time or password protect the dashboards.
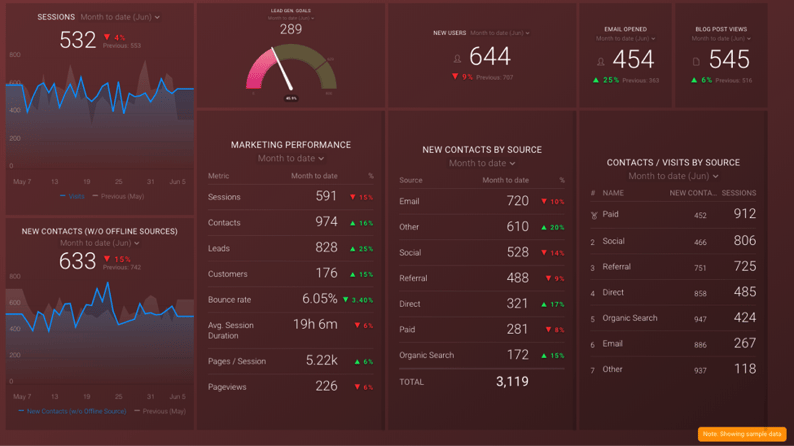
5. Drill Deeper
Why settle for metrics that just scratch the surface of your data when you can take it a step further?
If your dashboards are properly constructed, data visualization surfaces the important, high-level details you need to drill down even deeper. Using this technology, you can ensure that your data answers three questions:
- What happened? Analyze your KPIs over time. How have they fluctuated? Are there any trends you can identify?
- Why did it happen? Are there any context metrics that can help explain the data? Did you run a different social campaign or launch a new landing page that month?
- Does it matter? Include metrics that help the viewer understand to what extent the data moves performance towards your end goals.
Taking the time to set up, understand and analyze your dashboards will pay off as they present an in-depth representation of your performance and create immense value for your whole organization.
Source: Databox
Need Help With Your Monthly Analytics Reporting?
For $150/month, PR 20/20 can help you gain gain greater visibility into your marketing performance. Let's talk reporting.
.jpg?width=290&name=testimonial%20headshots%20(2).jpg)