%20Logo_BlueOrange_Trademark.png?width=800&height=269&name=Ready%20North%20(RN)%20Logo_BlueOrange_Trademark.png)


.jpg?width=300&name=Services%20Hub%203%20(3).jpg)


Based on our own analytic data, the vast majority of you reading this are marketers, sales pros, service professionals, and business executives.
In other words, we are creatives, strategists, communicators, and storytellers. I’d venture a bet that most of us did not get into our respective careers because of our love for statistics and math.
Yet here we are, working in the digital age of marketing. Everything is trackable.
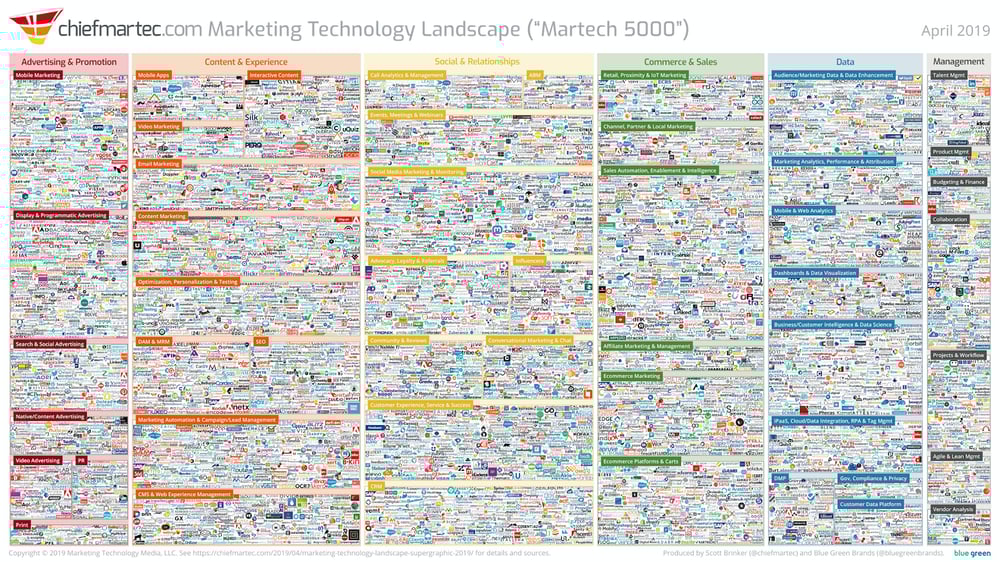
This is Scott Brinker’s Marketing Technology Landscape. Latest version includes 7,040 technologies, each of which captures and reports data. You can track and report on virtually anything.
But when you’ve got access to everything, how do you parse out what’s important? How do you implement the tracking and reporting that is going to get you closer to reaching your goals?
At the end of the day, data without some sort of strategic analysis is just an expensive distraction.
What we need to do is develop a process for prioritizing data, and turning that data into insights. We’ve got to take it further to transform those insights into actions, and then ensure those actions drive desired outcomes.
Here’s the other thing you’re up against, and let’s be honest with each other. Reports can be boring.

This is me proofing a client report. I’m sound asleep. To be fair to the report, at the time my two-year-old was nocturnal. But still. All of us have struggled to get through reports.
They can be boring, dense, packed with irrelevant information, and don’t really help us do our jobs any better. Why waste the time?
The good news is there is a way to not only create reports that keep people awake, but that actually engage and inform readers to make better marketing and business decisions.
The solution boils down to the following:
- Understand what matters.
- Craft a compelling story.
- Uncover useful insights.
- Create a repeatable process.
Chapter 1: Capture the right data.
Data-backed business and marketing decisions can push a company and campaign forward, but only if that data is clean, consistent, accurate, and representative of what’s actually happening. Otherwise, data can be your biggest roadblock to making meaningful progress.
But if data is everywhere and easily attainable, how do you unearth what’s important? The answer to that question requires a clearly defined objective, solid understanding of the tracking technologies available, and strategic planning.
1. Define your KPIs.
Step 1 is defining your key performance indicators (KPIs). What are you trying to achieve? What does success look like? And, how will you know if you’ve achieved it?
These are the main questions you have to answer before implementing any tracking and reporting system. The answers will help frame the story you’ll ultimately end up telling.
Here’s the challenge though, the answers to these questions will vary based on who you ask.

- Ask the CEO, and she’ll say revenue and profitability.
- Ask the VP of Sales, and he’ll say lead-to-sales conversion rates and sales volume.
- Ask the Marketing Director, and she’ll say qualified leads.
The value of your report is contingent on how well it speaks to what the reader cares about.
If you want others to read your marketing reports and process the information, the same report shouldn’t be sent to everyone. Personalize it to what matters to the recipient, and avoid getting distracted by metrics that don’t directly speak to those KPIs.
2. Find your source of truth.
With KPIs established, the next step is to define where these metrics, and all supporting data, are coming from. Common choices are Google Analytics, marketing automation tools (e.g. HubSpot), and/or CRMs (e.g. Salesforce).
There is no wrong answer here so long as the system captures the information you need to write a complete report. That said, once you decide on a technology, you need to stick with it.
Reason being, below are two traffic session timelines for the same site over the same timeframe.
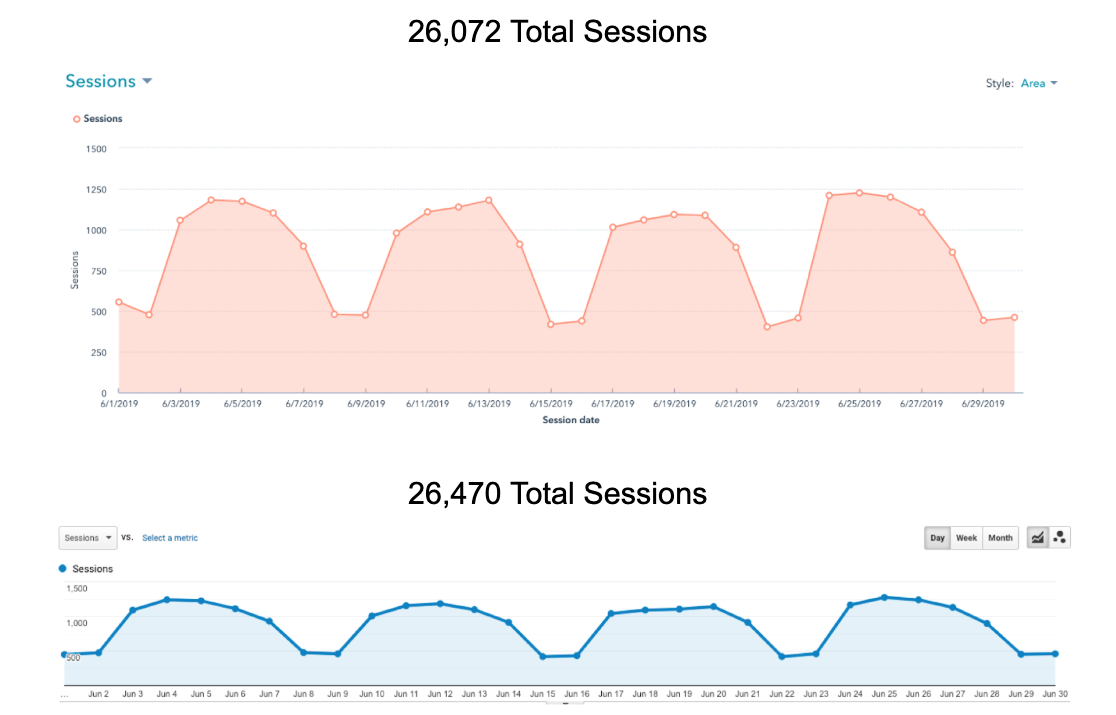
The first is from HubSpot and the second from Google Analytics. Notice the nearly 400-session difference between the two. It’s the same metric, shouldn’t it be the same number? Unfortunately, no.
The reason being, every technology captures and records data slightly different, and none of them are perfect. Each has its pros and cons.
With reporting, consistency is king. In many ways, tracking and reporting is like a science experiment, and to get the truest results, you need to control as many variables as possible. The more variables you can control, the less you have to take into account when conducting your analysis.
Pulling a metric from one technology one month and the same metric from a different tool the next will leave you with a disparity you can’t investigate effectively. Instead, your report will either under- or over-inflate the impact of what happened.
Decide up front on the technology you’re going to use and stick with it.
3. Clean your data.
Every company’s digital ecosystem is different. And, out of the box, your tracking technologies will try to capture all the data it’s designed to record. It’s incumbent on you to tell the technology what’s important track. In other words, how should it categorize different data and what should be filtered out.
Below is an example. I love this timeline. I’d like to show a client this timeline. All those spikes would be exciting to see.
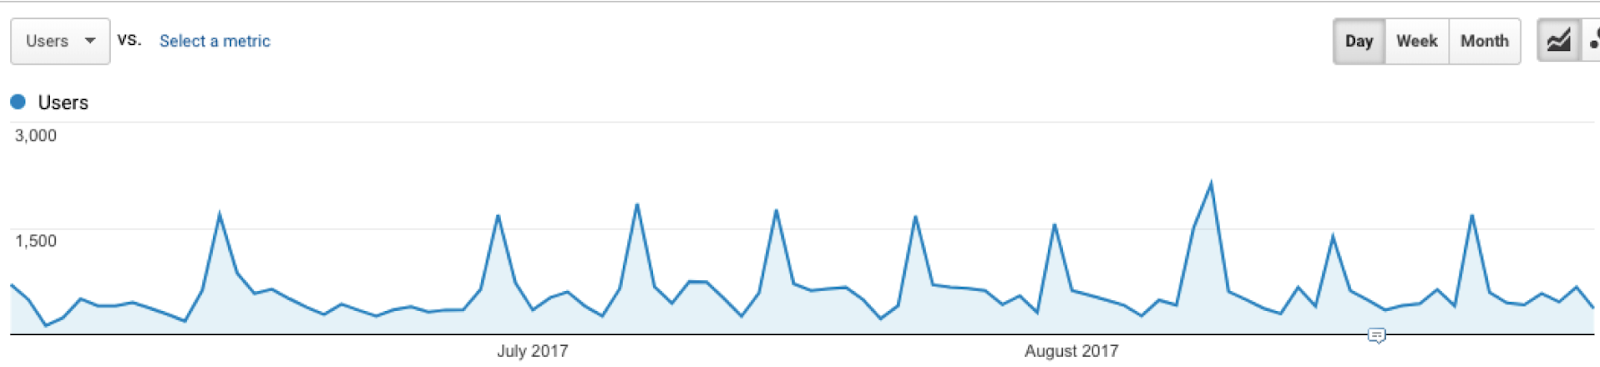
A prospect showed us something like this as a way to demonstrate the success of their email newsletter. On the surface, it looks great. But then we dove into the data.
Turns out those spikes weren’t coming from an email. Instead they were coming from a city in Virginia called Ashburn. In addition to other wonderful things I’m sure, Ashburn is home to a large Amazon Web Services data center. Residing at that datacenter are website bots, in particular, HubSpot’s bots.
These spikes in traffic were bot traffic, and they made up 68% of total recorded traffic. If you’re making decisions on this data, you’re setting yourself up for failure.
It is imperative that you take steps to protect the accuracy of your data by removing irrelevant information. Here are some filters to consider for your marketing technologies:
- Filter out internal IP addresses (Google “What is my IP address?”).
- Check any “Remove known bot traffic” boxes.
- Block irrelevant referral sources, in particular website staging and preview sites (e.g. preview.hs-sites.com).
- Exclude unnecessary query parameters.
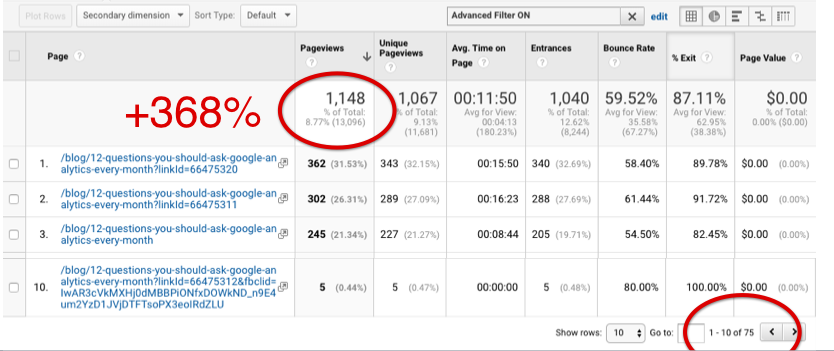
This last point needs attention because you’re probably not getting the full credit you deserve.
Get the credit you deserve.
Query parameters—www.readynorth.com/page?campaign=newsletter—are strings appended to the end of a URL that help tracking technologies understand and properly attribute website traffic and lead activity.
If one of your sources of truth is Google Analytics, the challenge you’ll have is this system treats each unique URL as its own page. In other words, something.com/page?campaign=blog and something.com/page are not considered the same page.
For that reason, if your tracking tools use query parameters, only reporting on the performance of the first Page in your reports may not show the entire picture.
In one case, visits to one Ready North blog post were 368% higher than what was reported by the first listing because Google Analytics recognized 75 different versions of the page.
Only reporting on one URL:
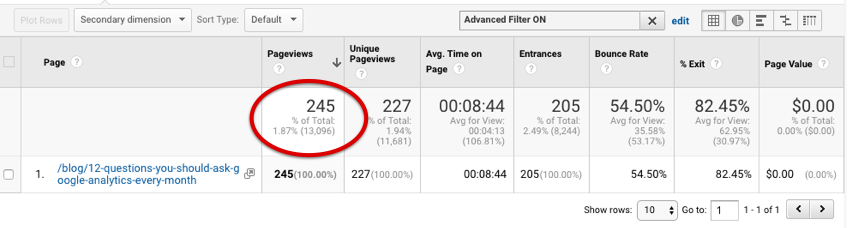
Reporting on all URL variations:
Now you can’t go and remove all query parameters. Google Analytics needs some of them (e.g. those from Google Ads) to property attribute traffic.
An alternative solution is to instead use “Page Title” as the primary dimension rather than “Page.” This will wrap all the traffic under the page’s page title which will be consistent across every URL variation.
4. Segment where possible.
Not all website traffic is created equal. Different audiences come to your site for different reasons and potentially interact with it in different ways.
The best example of this is common among software as a service companies. In most cases, these companies enable customers to log in to their accounts using links placed at the top of their sites.
This traffic is by-in-large irrelevant to your marketing program and lead generation campaigns, yet it often remains within traffic reports. It convolutes any data you’re using to evaluate performance.
To avoid data that isn’t relevant to the focus of your analysis, consider using segments and filters in your tracking and reporting tools to group similar audiences together.
To do this:
- Consider all the audiences who may be visiting your site (i.e. prospects, customers, partners, media).
- If possible, identify pages or elements on your site that each audience will gravitate towards. What you’re looking for is something only that audience would be interested in (e.g. customers — a login link).
- Create a filter or segment that isolates visitors who do that specific activity.
Some common segments we use include:
- Enter the site through a blog page (typically top of the funnel traffic).
- Traffic from specific countries.
- Traffic by device (can have different intent).
- Traffic that views our pricing page (typically middle of the funnel traffic).
- Traffic from irrelevant lead sources.
By isolating and excluding or including different audiences from reports, you can get a truer view of your marketing performance and uncover insights that may have otherwise been buried in irrelevant data.
5. Go beyond the basics.
Out of the box, many tracking tools are pretty powerful. You can capture and report on a great deal.
However, by turning on different features or pairing tracking tools with other technologies, you can unlock new, useful information.
.png?width=512&name=unnamed%20(3).png)
One such technology is Google Tag Manager. At this point, it is a must-have for any marketing technology stack. When paired with Google Analytics, it can be configured to capture:
- Clicks on external site links.
- Clicks on embedded YouTube videos and how long someone viewed a video.
- Clicks on interactive elements (e.g. buttons, widgets).
- PDF file downloads.
- Form interactions.
- Much much more.
One of my absolute favorites is scroll tracking. Google Tag Manager can be set up to record an event every time someone scrolls a certain percentage down a page (e.g. 25%, 50%, 75%, and 90%).
How far someone goes down a page is very helpful in determining how engaged that visitor was with your content, as well as identifying the optimal placement of calls to action. Speaking of which...

Chapter 2: Tell the story.
Now that we have the data in place, it’s time to start crafting the story. Stories can inform, entertain and motivate us is a variety of ways. But most importantly, if told the right way that can keep our attention and make us care.
“Make me care. Please. Emotionally, intellectually, aesthetically, just make me care.”
According to Andrew Stanton (filmmaker of Toy Story and WALL-E) in his 2012 TED Talk, this is the greatest story commandment. But, how do we do this when building a report? It’s a bunch of numbers, right?
Well, the answer to that question depends on how you present the numbers.
6. Establish benchmarks.
Every great story has a beginning. Every superhero has an origin story. It’s our reference point to reflect back on as our characters grow or evolved throughout the story.
What is your marketing program’s origin story? Where are you starting so that in three, six, 12 months down the road, you can look back and say, “Hey, that’s where we came from, and this is how much better off we are now.”

Benchmark data also helps you establish and understand growth patterns, and answer questions like, “Is 5% growth over last quarter good?” It provides an essential frame of reference.
Now, there are a ton of industry benchmarks that you can reference within your reports, but there are also hundreds of factors that affect data, which aren’t necessarily relevant to your situation.
You need to establish your own benchmarks for them to be useful. Comparing your current metrics and KPIs against where you were the previous period can quickly isolate growth opportunities and trouble areas specific to you.
In terms of timeframes, if you have four years of data, you’re in really good shape, but most of us don’t. So some other time frames to consider:
- One month’s worth of data is the minimum to shoot for.
- Three months is better to allow for month-over-month fluctuations.
- One year is ideal because you can take into account seasonal trends.
When establishing these benchmarks, remember that if you’ve added filters to clean your data, that’s your new truth. Comparing the cleaned data against old data won’t offer accurate comparison.
For example, if your comparison data includes 68% bot traffic, it will be a long time before you live up to that falsely inflated benchmark.
7. Set goals.
In a story, characters have some motivation—a stated or unstated desire that compels them in a direction. Our understanding of and interest in seeing the characters try to achieve this goal is part of what keeps our attention throughout the story.
From a marketing perspective, we already know what we’re trying to do (KPIs), and where we currently are (Benchmarks), but in three or six or 12 months down the road, where do we want to be?
Benchmarks give us a view of how far we’ve come, BUT goals show us how far we have yet to go. The context of these two elements can create compelling drama for the readers.
So what is your marketing goal?
Your answer can’t be a generic statement, like I want to be an influencer? Or I want to grow organic traffic? Or I want to convert more leads.
There’s a formula for stating marketing goals that will help give you clarity and direction.
The formula uses the acronym SMART:
- Specific: Clearly establish what is to be achieved.
- Measurable: Assign a metric to the goal.
- Attainable: Make the goal realistic considering where you’re currently at and past performance. At the same time, challenge yourself to go beyond your comfort zone.
- Relevant: Align the goal with the overall business goals. Make sure you’re impacting business growth.
- Timely: Give your goal a cut-off date. Open-ended goals don’t create a sense of urgency.
Once you’ve got your overall marketing goals defined, consider setting intermittent goals. If by the end of the quarter you want to grow traffic 10%, where do you need to be by the end of month one to ensure you’re on pace?
By setting shorter timeframes, you can be more proactive in adjusting strategy and campaigns to make sure you reach your goals.
8. Visualize your data.
This may be a bold statement but I think the philologists of the world will back me up. The best stories ever written include pictures. My kids will second that, but to be fair, I only read them comic books.
Visuals help to tell a story in a way words can’t. Pictures can say more in less space and they are far more interesting to look at. For this reason, your performance reporting needs data visualization.
Potential data visualization tools to consider include:
- Databox (free and paid accounts)
- Google Data Studio (free)
- Google Analytics (free)
- HubSpot (free and paid accounts)
- Tableau (paid)
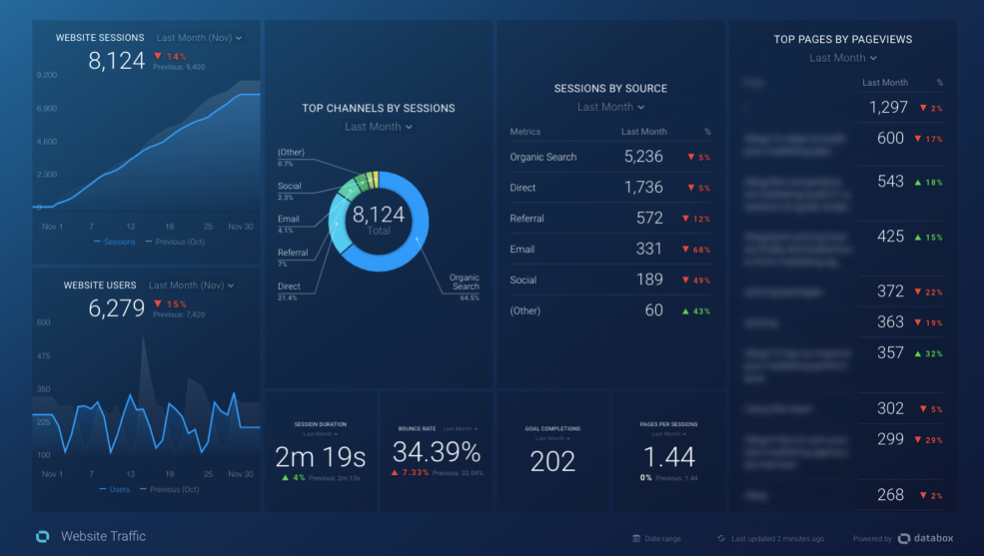
Constructing your dashboards.
When building your dashboards, there needs to be a rhyme and a reason behind what’s featured and where. It needs to guide people through the story.
When constructing your dashboard, think about it in terms of four elements:
- KPI: Make the primary focal point the primary KPI.
- Support metrics: Surround the KPI with supporting metrics. These metrics provide color and context, making the KPI module much more informative.
- Goals: Place a reference to what you’re trying to achieve right next to the KPI.
- Benchmarks: Combine current timeframe data with past performance in the same charts and graphics. Most data visualization tools can subtly show previous timeframe metrics without taking away from the primary metrics.
A couple of other tips when building scorecards:
- Combine data sources where necessary, but try to keep as much as possible to one single source of truth.
- Keep dashboards simple and straightforward. Avoid overcomplicating the dashboard with too many visuals.
- Don’t try to tell the entire story with one dashboard. Depending on the audience, there is often not enough room to tell the entire story effectively in one screen.
9. Narrate what happened.
Even with visuals, your story needs a narrator. Someone to help the reader make sense of what they’re seeing and highlight what’s important to know.
For this reason, a text-based analysis is key to supporting your visualizations. As the report author, it’s incumbent on you to provide the explanation of what’s happening and underscore its significance (or lack thereof) with relevant context.
Connect the dots for the reader in a way the visualizations cannot. But how can you write a story about numbers without getting bogged down by the mundanity of it all?
To ensure your narratives are read and processed by the reader, they need to adhere to the following rules:
- Reference Your Visuals: Where possible reference your visuals to help illustrate a specific point so you don’t have to spell it out as part of the description.
- Keep Explanations Short: Don’t get long winded with your copy. Too much text or long descriptions can quickly evaporate attention. Use shorthand where possible. For example, instead of writing “this was a 25% improvement over last month” use (+25% over last month).
- Get to the Point: Avoid fluffy adjectives. Let the numbers speak for themselves and let the reader draw their own conclusions on their significance.
- Easy to Scan: Break up your report with subheads, use bolding and apply different color fonts to help readers scan your report. They won’t read the whole thing, so make sure their eyes are drawn to the important stuff they’ll find most relevant.
- Provide Context: Aways compare numbers to something, whether it be benchmarks, goals or a past timeframe.
- Pair Percentages: Percentages on their own can be misleading without some anchor to reality. For example, a 100% increase disguises the insignificance of going from 1 visitor to 2.
- Embrace Negatives: The inclination is to downplay negative numbers because it’s associated with failing. The reality is none of us knows what marketing campaigns are going to work and which aren’t. Call attention to the negatives as learning opportunities. Just make sure to call out what you’ve learned and how those lessons will be applied in the future.
- Back Up Guesswork: Inherently you’ll start to draw conclusions from the data, which is good and should be encouraged. But make sure any conclusions are grounded in data, and not guess work. In other words, don’t say, “this likely happened because of this.” Instead say, “the data indicates this happened because of this, and here’s how we are going to test that correlation in the future.”
Question and answer approach to reporting.
One approach we’ve taken with our reports that’s worked well is asking and then answering a series of standard questions.
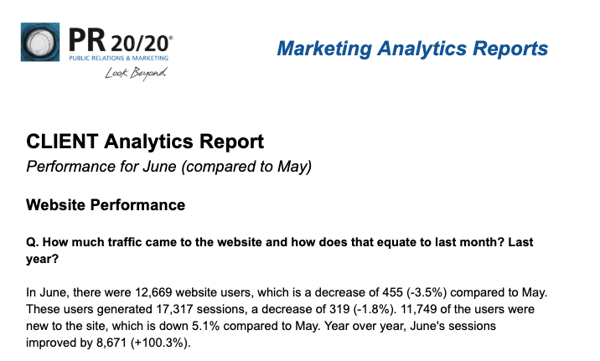
We have a standard list of questions we ask of our marketing analytics data each month, and then answer those questions in one to two sentences. This approach helps to remind the reader of what’s important to think about, and helps avoid going on tangents with the explanations because the answers have to speak specifically to the question asked.
For information on how to automate your text-based analysis check out this blog post.
Save Time: Automate Marketing Performance Reporting
10. Stay consistent.
If you’ve ever read a book to a child, you know the importance of keeping it consistent. You’ll be shouted out of the house if you, say, give a character a voice one time and then not the second time.
Kids find value in the consistency. It helps them learn. As adults, we also learn through repetition.
After months and months of writing the same report the same way, there will be a tendency to spice it up. I urge you to fight it!
Reason being, only by becoming familiar with the usual can you spot the unusual.
Depending on how many visitors and leads you receive, spotting a change in the status quo usually requires a significant trend/anomaly/event to take place. But the more familiar you are with “normal,” the faster you can spot otherwise subtle fluctuations.
Your awareness and response time can mean the difference between securing a valuable win and failing to address a growing problem while it's fixable.
Chapter 3: Uncover insights.
We have our data and we now know how to tell the story of what happened. But the most valuable parts of any report are the insights that can be extracted.
Insights are typically hidden in plain site, and only by asking the right questions can you bring them to light. Specifically:
- What happened?
- Why?
- Does it matter?
11. Ask "why?" five times.
In the book The Toyota Way, author Jeffrey K. Liker discusses Toyota’s method for getting to the root cause of an issue in their production line. This process is called 5 Whys.
According to the book, by asking why five times Toyota can “pursue the deeper, systematic causes of a problem” rather than simply finding the source of the problem. In other words, the reason a car may leak oil is a poorly made gasket, but the root cause of that issue is actually a flaw in the evaluation policy for purchasing agents.
Put another way, by repeatedly asking why you can go beyond superficial insights (e.g. Twitter audiences really like analytics-related content) to unlocking powerful insights about what drives growth (e.g. @GoogleAnalytics will share Google Analytics related content if we tag them on Twitter).
Allow me to provide an example. A similar scenario played out for one of or clients.
Situation: Traffic to our site is up 2,000 sessions.
- Why? Organic search is up 1,500 sessions.
- Why? Google traffic is up 1,400 sessions.
- Why? Google traffic to “Sample Post Title” is up 1,200 sessions.
- Why? The post’s average ranking broke the top 10 for the first time.
- Why? The content filled a topic gap on the search results page.
In most cases, many of us would have stopped after Why #3 because knowing that a post did well on Google Search is enough to justify more blog posts about that topic. But at this point, all we’ve learned is a generic assumption, not a specific lesson that we can put into action.
Instead, by continuing to ask Why? we discovered an approach to Search Engine Optimization that we applied across a myriad of topics, aggressively growing search traffic.
This the goal of the 5 Why? process, to uncover a specific, actionable insight that we can put into our next marketing campaign.
And in most cases, to uncover that valuable insight will require stepping outside of your analytics tools and combining the data with your intuition, experience and understanding of the situation (context).
Tips for executing 5 Why?
- Study how dimensions and metrics within your tracking tools interrelate.
- Prioritize your focus on total change, not total volume. In other words, Organic Search may be your top traffic driving channel, but if the biggest change in traffic was thanks to Referral sources. Start your analysis there.
- Keep your “Why” answers short. Don’t try to explain too much, just answer the question and ask Why? again.
- Keep digging till you find an insight you can test.
12. Ask, "does it matter?"
Not all fluctuations in your data are created equal, which is why you should always ask, “does it matter?” before implementing any insights.
Case in point, in 2009 after watching the MTV Music Awards when Kanye interrupted Taylor Swift’s acceptance speech, I wrote a blog post about how the whole thing as a publicity stunt. We published it on a Monday, and on Tuesday morning I checked the previous day’s traffic.
-1.png?width=1600&name=pasted%20image%200%20(1)-1.png)
Visitors to the site had exploded. In one night, we received as much traffic as the previous year combined. I had to fight the urge to run into my boss’ office and say we’re scrapping the content calendar and only writing about Kanye West from now on.
Fortunately, before doing this, I choose to look a little closer at the data. While visitors were through the roof, they bounced from the site 99% of the time, viewed 1.1 pages on average, stayed on the page for 3 seconds on average, and no one subscribed.
In relation to our goal of driving blog subscribers, this spike in traffic was irrelevant. While fun to see, it got us no closer to achieving our goals and thus nothing of value could be applied to future campaigns.
13. Ask AI.
Analytics analysis is a perfect use case for artificial intelligence (AI). AI has the ability to process huge datasets, and then use that information to make connections and predictions about future behavior.
So, why not take advantage of AI to surface analytics insights? The good news is everyone of us has access to a free AI tool in Google Analytics called Intelligence. This tool can be found in the upper right hand corner of the desktop console and mobile app.
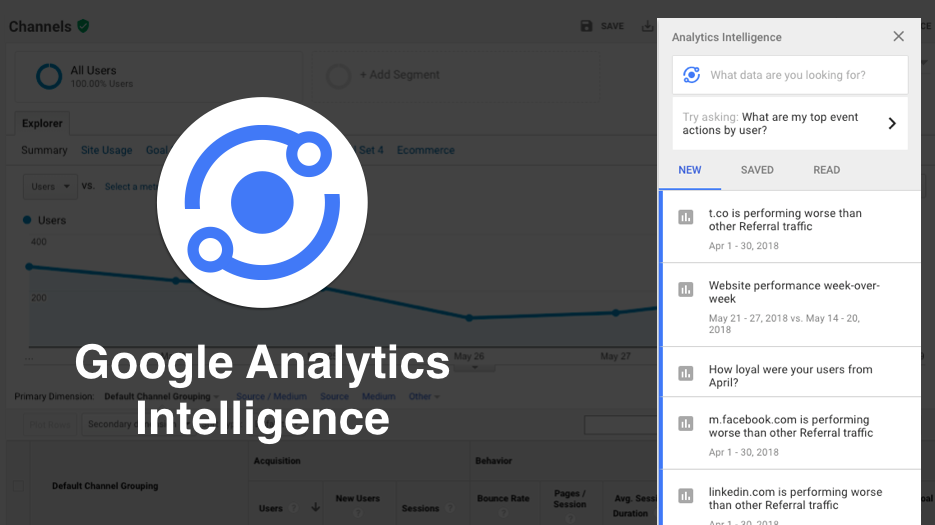
Google Analytics Intelligence surfaces fluctuations in your data, and allows you to ask questions about it. Specifically, it can surface for you:
- Pageview spikes.
- Week-over-week performance.
- Performance above average.
- Drops in conversion rates.
- Trends.
- User sources.
- And much more.
After each Intelligence note, it asks you if this was helpful? Your answer is what’s used to train the AI technology. The more you use it, the smarter it becomes.
Unfortunately, at this moment, the tool has its limitations, and there aren’t a lot of other options out there. But here’s the thing, millions of dollars are being funneled into AI, specifically in the marketing space.
Keep an eye on this area by subscribing to Marketing AI Institute as new tools will be popping up or advancing their capabilities all the time.
Chapter 4: Take action.
All this data, the reports and the insights are nothing if you don’t act on it. Everything we’ve done is only going to point you in specific directions. And, to level-set expectations, 9 out of 10 times, those directions are going to translate to small, incremental improvements; not strategy-altering revelations.
Your job is to take the insights gleaned from your reports and use them like a scientist would. Apply the scientific model.
- Construct a hypothesis.
- Devise an experiment to test your hypothesis.
- Analyze the results, draw out conclusions.
- Repeat the process over again.
People are going to read your reports, process your insights, and then they are going to ask, “What are we doing about it?”
This is your answer. These tests. These experiments are your answer. Over time these little experiments can add up to make significant progress towards reaching your goals.
Final Thought
“Without data you’re just another person with an opinion.”
- William Edwards Deming.
If you really want to get buy-in from leadership and make a difference in your job. You need data. It’s easy to argue against an opinion, but it’s hard to win an argument when that opinion is backed by data.
At Google, when anyone seeks to convince someone else of a direction, they say, “Let me show you,” and then prove their point with data. No one says, “I think.”
Clean, relevant, consistent data that’s used to tell a compelling story full of insights and action is the strongest way to not only push your marketing program forward, but also get buy-in from key decision makers along the way.
Turn data into intelligence, and intelligence into action.
At Ready North, we are obsessive about measurement and performance. Our professionals have strong analytical skills, specifically the ability to interpret website and marketing data, gauge campaign performance and clearly communicate results.
Let's talk reporting— explore our Marketing Analytics Reports or Databox services.